Contents
- A deep dive into pay rates, trends, and other insights
- Trends driving field service activity
- How are recent industry trends affecting field service?
- Work types
- What types of work are growing the fastest?
- Payment insights
- What are the latest trends in work order pricing?
- Connections
- How much are businesses and technicians connecting with each other?
- Take advantage of growth
Field Nation Quarterly Report for technicians
August 26, 2020
A deep dive into pay rates, trends, and other insights
The field services industry has been recovering. Market conditions have continued to improve after hitting a low in early April.
In this report, we’ll take a deep dive into data from the Field Nation marketplace. This data will help our technician community gain insights into current market conditions. We’ll examine:
- Trends driving field service activity
- Types of work that are growing the fastest
- Payment insights
- Payment terms
- Connections between businesses and technicians
Trends driving field service activity
How are recent industry trends affecting field service?
Stay-at-home orders, store closures, and other restrictions continue to evolve.
However, understanding the impact of industry trends can help you plan for your future. Here are a few highlights based on our recent experience working with clients:
Low-contact retail experiences
Consumers have shifted toward e-commerce, curbside pickup, and other low-contact experiences. As a result, we have seen an increase in reconfiguration and technology-based projects, such as remote-work communication applications.
Social distancing
Retailers continue to modify their locations to meet new social distancing and safety standards. We’ve noticed ongoing demand for installing products like sneeze guards, as well as signage to show proper distancing.
Hands-free technologies
Companies continue to invest in new ways to go hands-free. Businesses are looking for field service professionals to replace locks, pin pads, and install a whole range of other hands-free devices.
Sanitation work
Technology and automation are making sanitization more efficient and scalable. We’ve experienced strong growth in helping clients modify and upgrade their existing high-end cleaning equipment. We also expect new sanitation technologies will come to market. Here are a few tips if you’re interested in seeking out this type of work:
- Search for common types of work that have sanitation needs, e.g. ATM, Kiosk, and General Task.
- Make sure your profile is up-to-date. Customers looking to fill this type of work are looking for updated screenings and positive endorsements.
- Get an updated background check or drug screening, as many of these projects are in airports and banks.
- Be willing to accept bundled work orders within a given radius.
Personal Protective Equipment (PPE)
Protocols for PPE are common across many types of projects. More clients are including PPE requirements in their scope of work or giving technicians access to PPE to keep technicians safe while on-site.
Work types
What types of work are growing the fastest?
Where should technicians look for opportunities? A good place to start is with the types of work that are growing.
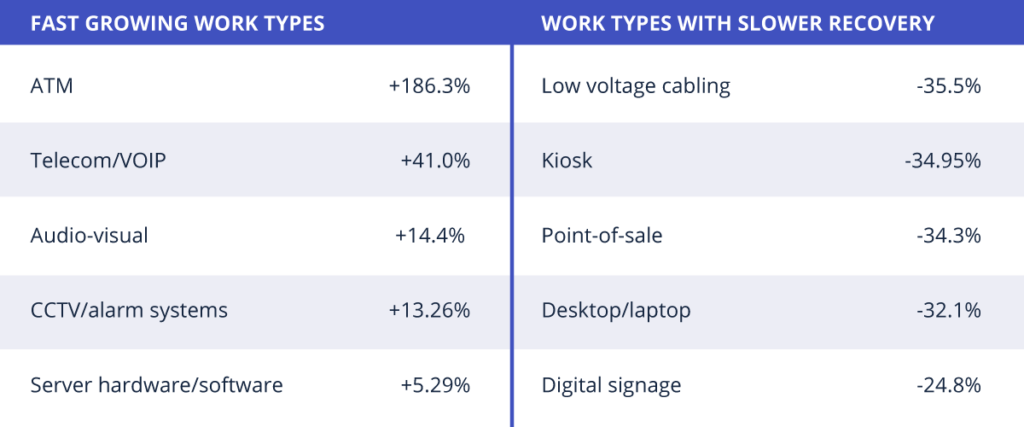
We are seeing an increased demand across certain work types, such as ATM and telecom projects. But some other work types like low-voltage cabling and kiosks have been slower to recover.
As of week 33 (the week of August 17), here are year-over-year trends across the Field Nation marketplace of 7,000+ clients for key work types.
Payment insights
What are the latest trends in work order pricing?
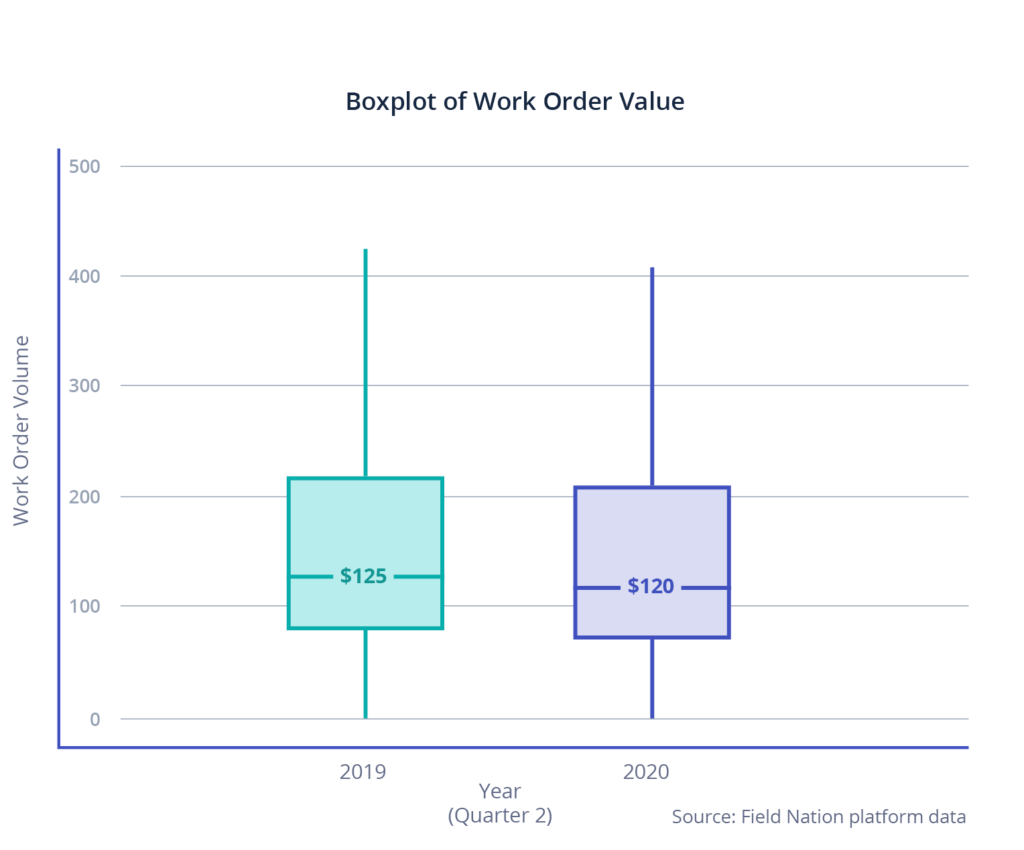
Despite market volatility, work order value and technician pay have remained consistent year-over-year.
The average value of work orders on the Field Nation network is approximately the same in 2020 as it was in 2019, with a slight decline from $125 to $120. This is based on average work order value across the United States.
Similarly, median hourly rates are close to 2019 levels. Hourly rates have increased slightly in work types such as point-of-sale and networking with rates rising ~11 percent.
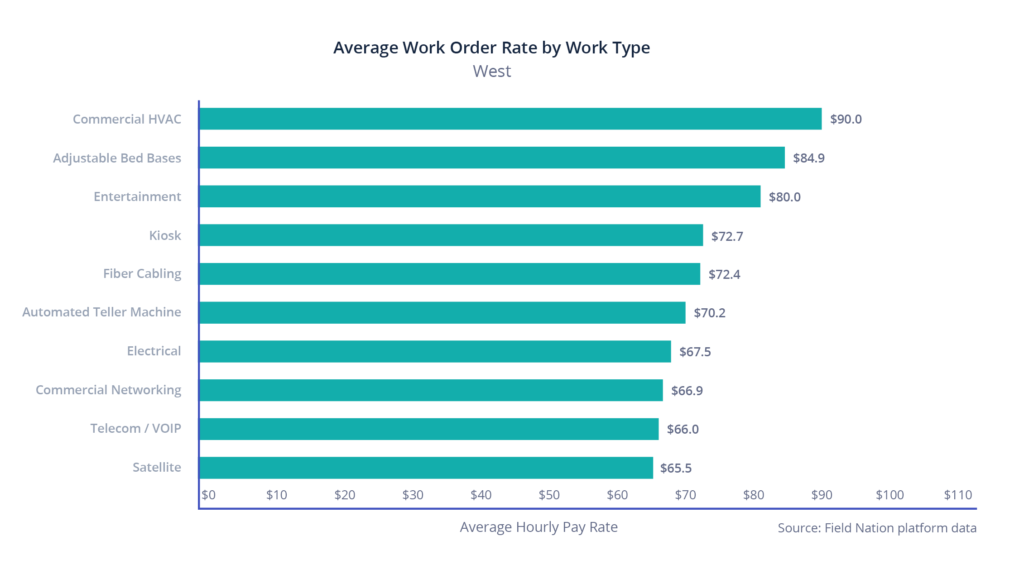
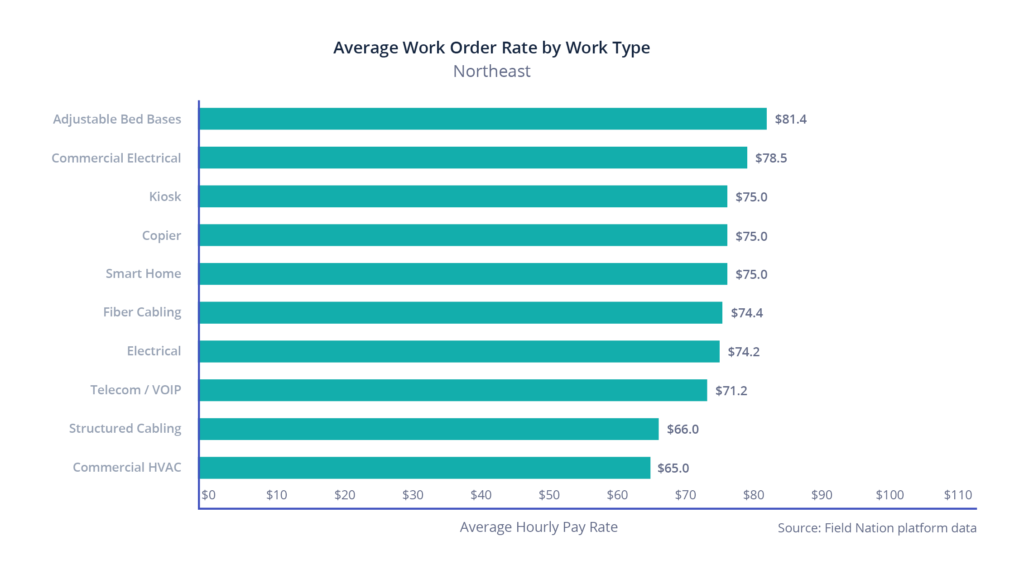
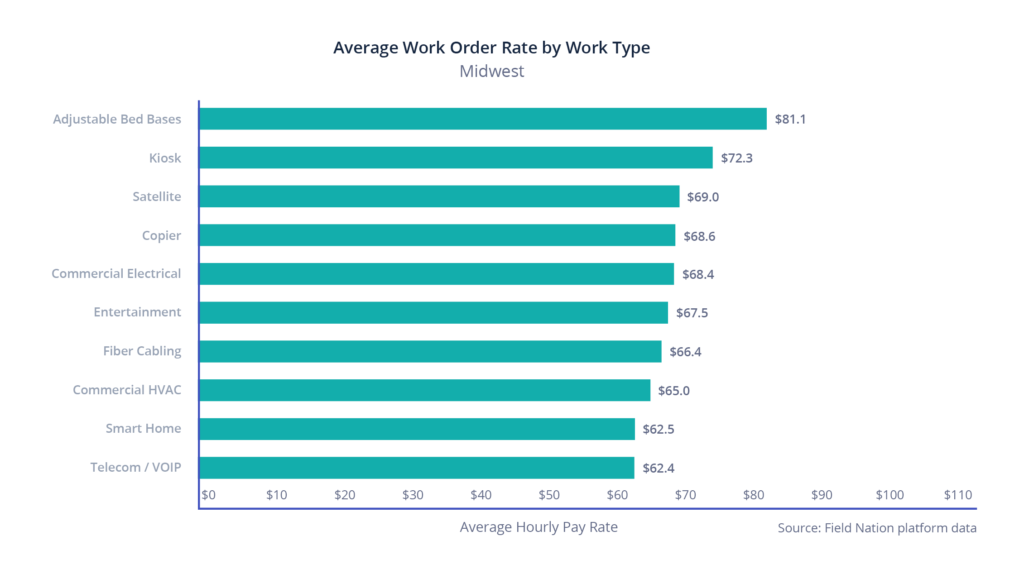
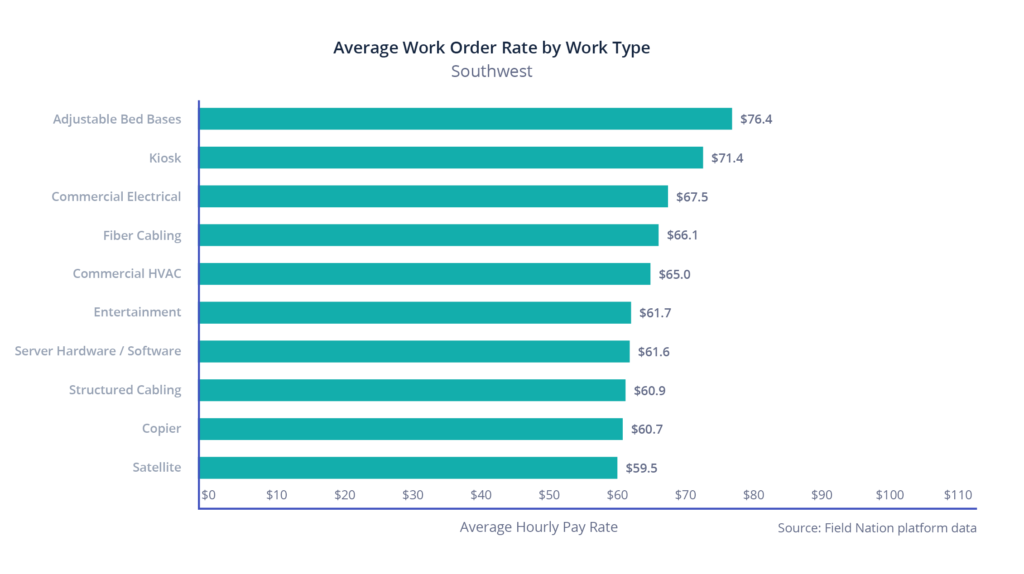
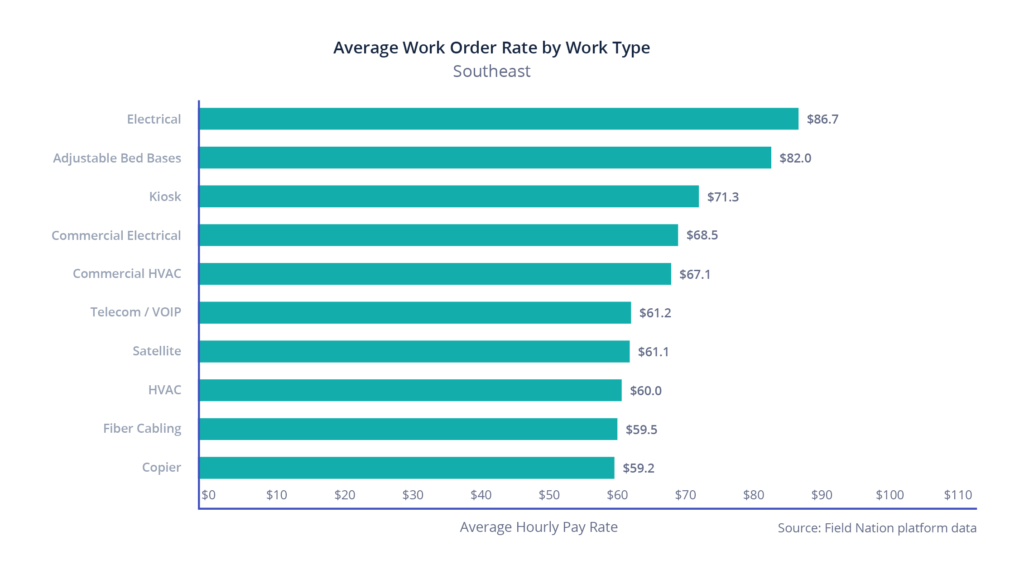
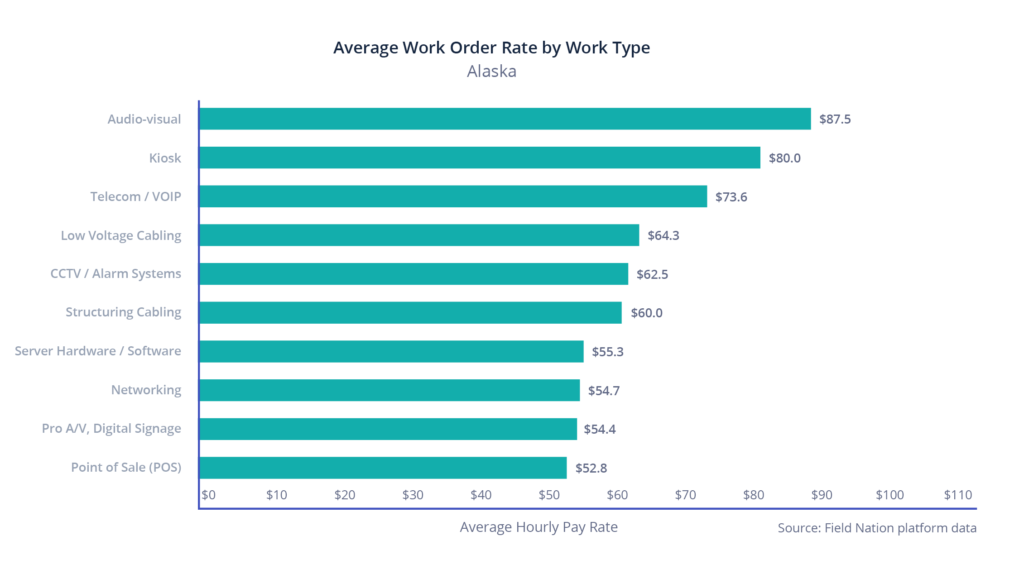
Additionally, we analyzed hourly rates by type of work for the following U.S. regions:
- West
- Northeast
- Midwest
- Southwest
- Southeast
- Hawaii1
- Alaska2
These charts represent regional hourly rates across the highest-earning work types over the last 12 months. They do not represent overall work order value. Note: Pay rates across states and cities can vary from regional rates. This data represents regional averages.
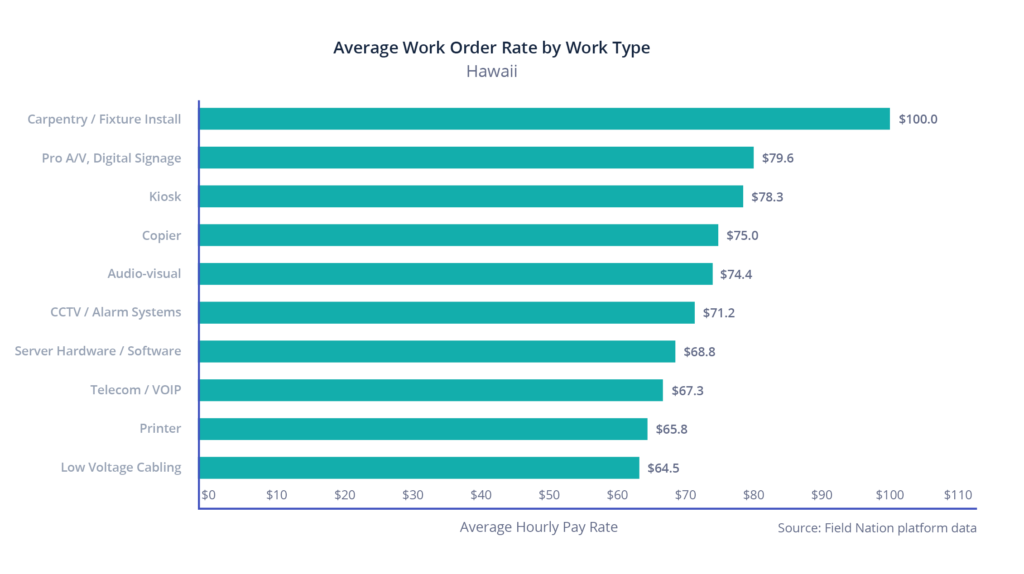 1Hawaii was analyzed separately from other states in the Western region.
2Alaska was analyzed separately from other states in the Western region.
Payment terms: more opportunities for you
Field Nation added payment terms to bring more work to the marketplace.
From May through July 2020, there were 70 percent more work orders on the platform. This increase comes from:
- 112 net-new buyers who joined the marketplace
- Current buyers who put even more work on the platform because of additional payment flexibility
- Projects that were scheduled in Q2, were delayed, and are now scheduled for Q3
Work orders paid on approval
In July 2020, 58.5 percent of work orders are paid the Friday following approval — a seven percent increase from the previous 12 months. We believe this increase is due to increased transparency of buyers’ payment terms with Field Nation. Some buyers, large and small, have reduced their term length, or have moved to pre-fund their work orders so that technicians can get paid faster for their work. Please note that some buyers may not be able to make these financial changes, and that their payment term may be critical to their ability to post work to the platform.
Connections
How much are businesses and technicians connecting with each other?
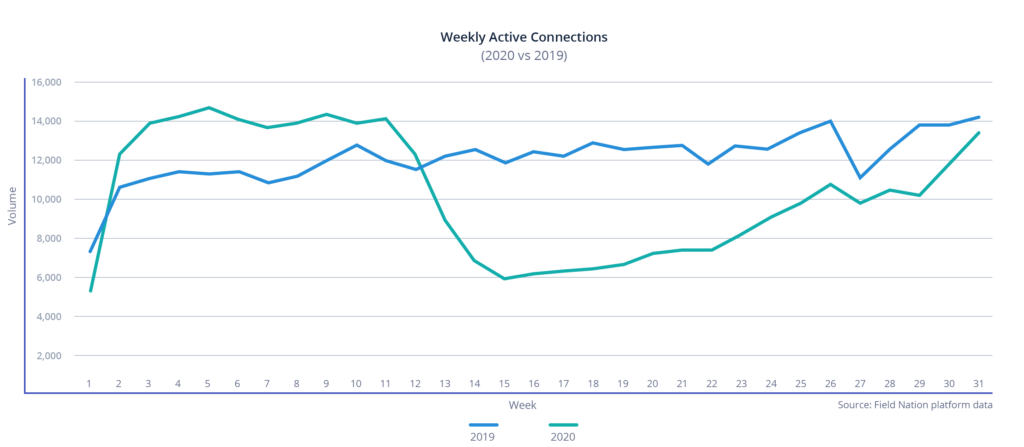
Another positive trend is the consistent number of connections between businesses and technicians. Weekly active connections, or the percentage of new connections between businesses and technicians, increased 121 percent in the past 16 weeks. Also, 13 percent of these connections represent companies and technicians that have never worked together before.
Even in these turbulent times, businesses continue to trust the Field Nation marketplace and build new relationships with technicians who take work on the platform.
Take advantage of growth
If you’re new to Field Nation, now is a great time to create a profile. If you’ve worked with us before, it’s the perfect time to update your existing profile with new skills or explore new ways to get more work on our platform. By doing so, you’ll be well-positioned to take advantage of opportunities as they arise.
We hope this data gives you helpful insights into IT field service trends. If you have feedback on data you’d like to see, email us at [email protected]. If you have questions about onboarding, creating or updating your profile, contact [email protected].
RELATED RESOURCES
More from the field
- Field Service
- Product Updates
- Blog
- Best Practices
- Business Growth
- Blog
- Business Growth
- Field Service
- Blog


