
Read time: 4 minutes

At the start of the new year, many field service organizations want to create reports about the past year’s activity. Here’s a step-by-step guide to generating three of the most popular year-end reports on the Field Nation platform.
If you need a refresh on generating reports, watch this video to learn how to run a work order activity report. (Click here for the article version).
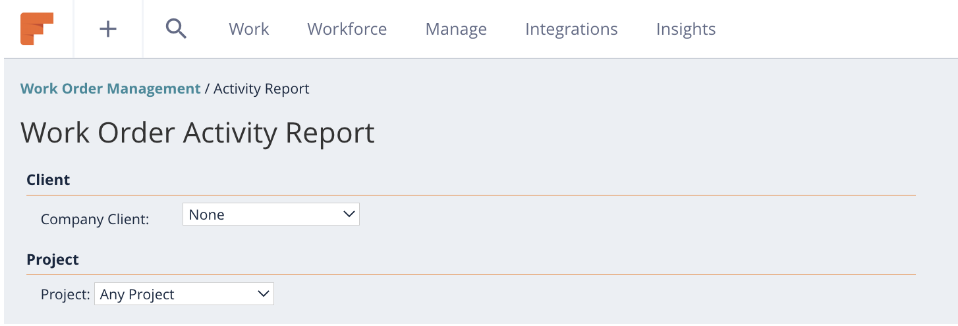
Year-end reports can be produced at a high level or for specific clients or projects. Start by navigating to the Work Order Activity Report Management page. Select the Client and/or Project you would like to report on. Or, keep both fields blank to understand your overall company metrics.
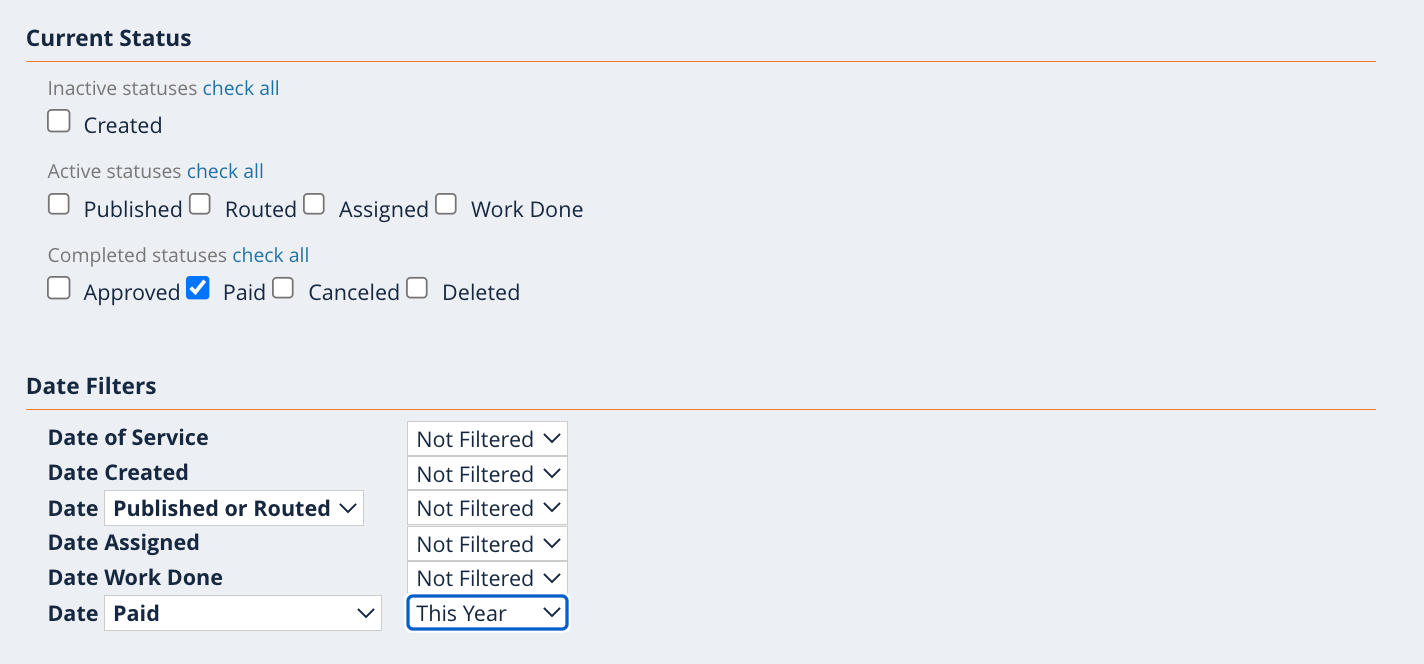
Next, select Paid from Current Status to ensure the work orders in the report include finalized numbers only. Then, select the timeframe of the paid work. For this example, we have selected Date Paid with a filter of Last Year. Next, click Configure Fields.
From the Field Configuration page, follow the three guides below to create the right report for your needs.
Note: Some criteria will be listed as optional. If selected, the criteria will give you a better idea of where your spend originates versus just looking at your overall spend.
The Total Spend Report helps you see how much your company has spent on completed work orders.
Work Order:
Work Order Location & Contact
Work Order Description:
Work Order Completion Information:
Work Order Payment
Custom Fields:
Once you have chosen the data to include, click Generate Report.
The Pay Rate Breakdown report allows you to understand overall pay rates or pay rates for specific clients or projects.
Work Order:
Work Order Location & Contact:
Work Order Description:
Accounting:
Work Order Completion Information:
Work Order Payment:
Custom Fields:
Once all data is selected, click Generate Report.
The Expense Review report provides an overview of expenses, including those for specific clients or projects.
Work Order:
Work Order Location & Contact
Work Order Description:
Work Order Completion Information:
Custom Fields:
*Reminder: Only select approved expenses as these numbers will be finalized in your report. Selecting any reported, pending, or possible expense options may result in inaccurate data as these are not finalized numbers.
Once all data is selected, click Generate Report.
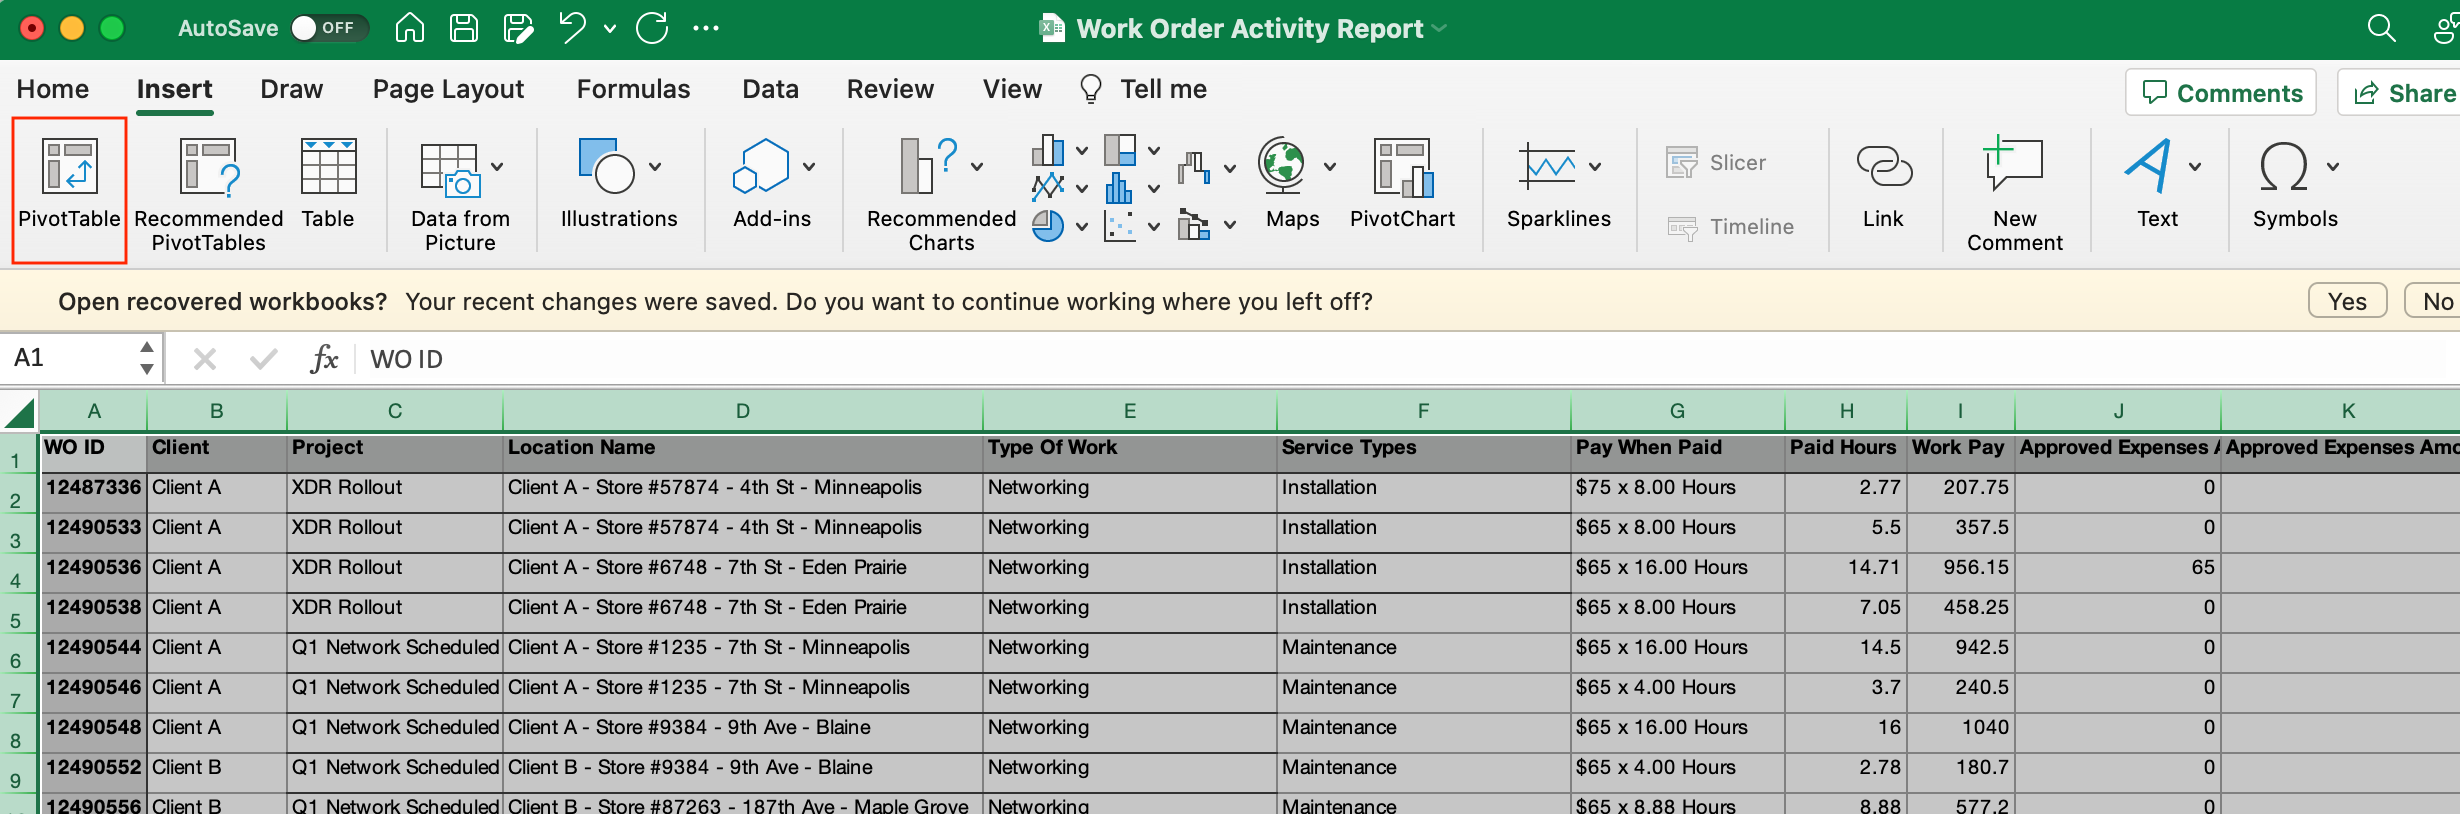
Export your CSV file to Excel, and create visualizations of your spend using pivot tables. Here you can use the optional fields to break out your spend based on client, project, locations, and more.
Below is an example of using pivot tables to find total spend broken down for each client, and each project for each client.
1. Highlight your original data and create a pivot table.
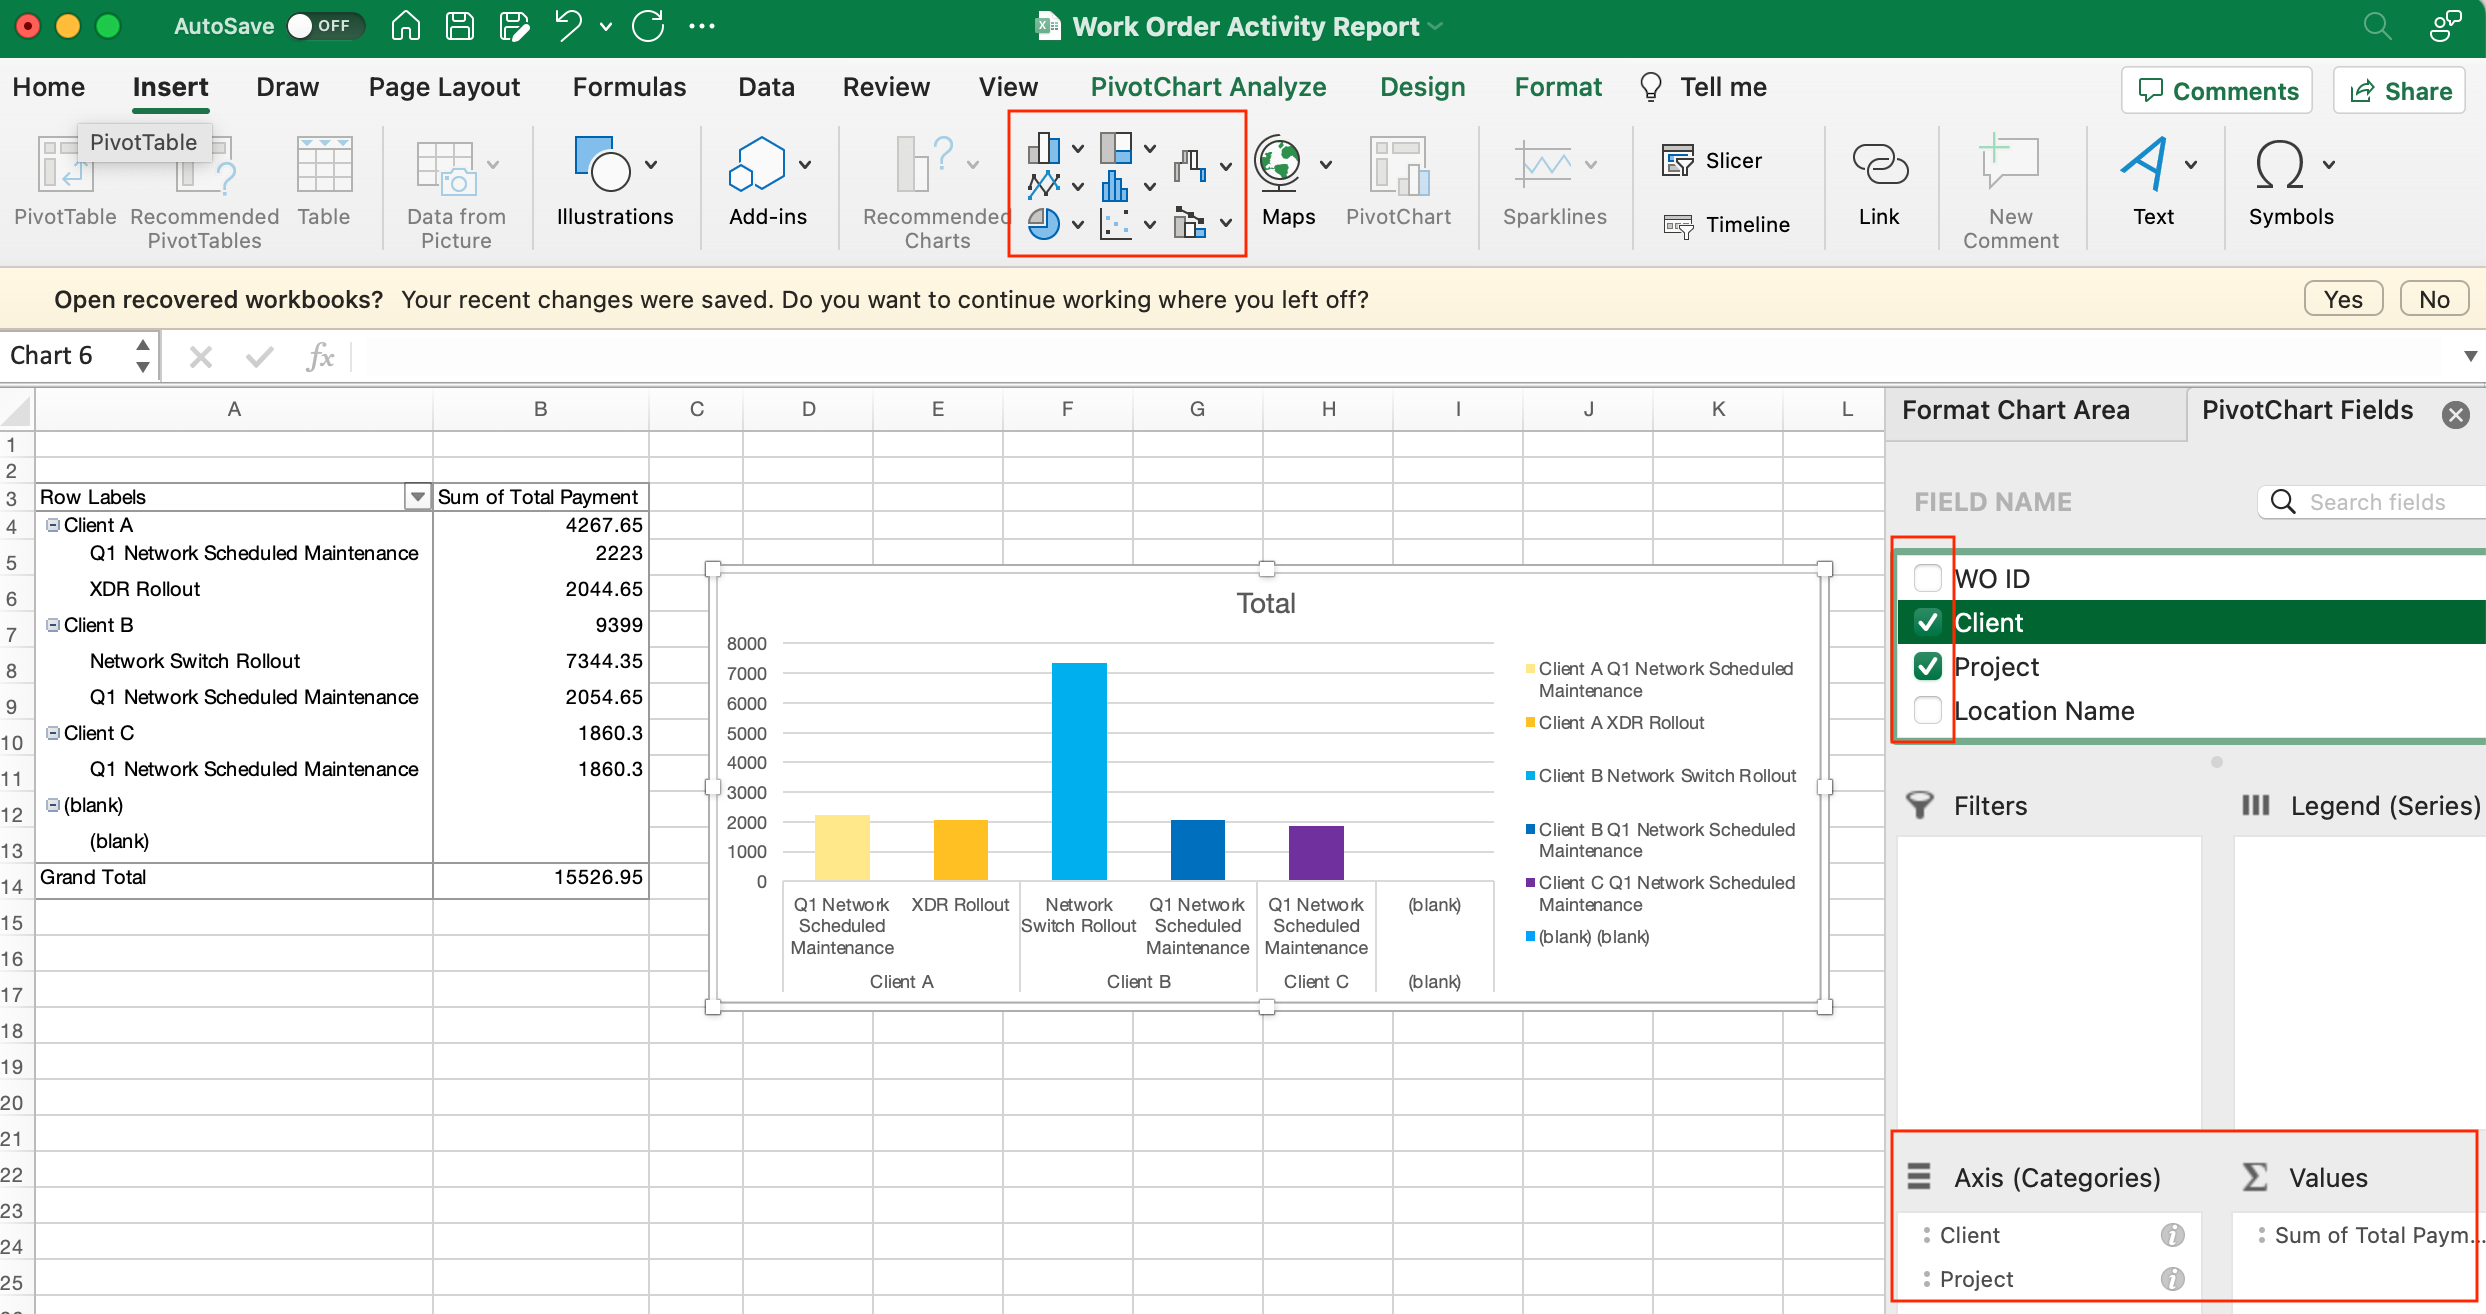
2. On the right hand side, select the columns of information you would like added to your pivot tables (Client, Project, Total Spend, etc.), then choose how you would like this information to display within your pivot table. Add a visual representation by selecting your chart from above.
Visit our Help Center or contact our sales team if you’d like more tips to help your company stand out on the marketplace.
We aim to create content that adds value. To help us iterate and improve, please take one minute to share your feedback on this piece. Your feedback will inform the content we create for you and the market in the future.