
Read time: 6 minutes

Many service companies are surprised to find how much labor rates fluctuate by week, month or location. Labor rates are also influenced by factors like population density, cost of living, duration of work, the availability of skilled labor, and market shifts.
For example, an hour of audio-visual work may have an average pay of $155 in South Portland, ME. However, that same job could have an average pay of $68 per hour in Minneapolis, MN. And average networking hourly pay rates in Bend, OR, fell from $65 in June to around $46 in August.
This variability, and sometimes volatility, makes it difficult to set the right hourly pay rates for projects or deployments, remain competitive when bidding on new work, and avoid eroding profitability in the process. Because when you do win a bid, you also need to make sure you win on margins.
Also, bidding on and fulfilling projects based on data from within your own four walls is limiting and incomplete. By the time you’ve gathered the data, market rates may have fluctuated due to general volatility or other factors.
So, how can you accurately price work for any location or skillset? Field Nation is here to help. With more than 10 years of market pay rate data for different work types and locations, Field Nation can provide you with an accurate average wage for any project, anywhere in the U.S. and Canada. Specifically, Field Nation has average rates by location, timeframe, and work type, and our data includes the low-end rate, average rate, and high-end rate based on historical data.
For example, let’s take a look at low-end, average, and high-end hourly rates on Field Nation for low-voltage technicians across U.S. metro areas between 10/26/19 and 10/26/20.
| Type of Work | Location | Average Hourly Rate* | The 25th percentile** | The 75th percentile*** |
| Low Voltage | Kappa, HI | 72.14 | 67.50 | 75.00 |
| Fairbanks, AK | 58.85 | 53.75 | 65.00 | |
| Midland, TX | 65.64 | 50.00 | 66.50 | |
| Cincinnati, OH | 55.37 | 40.00 | 60.00 | |
| Lexington, KY | 55.06 | 45.00 | 65.00 |
As you can see, the average pay for this type of work varies significantly across locations. In more remote locations, such as Kapaa, HI, the average pay is much higher. This is likely because there is less supply in these remote locations. Likewise, more populated cities such as Lexington, KY, and Cincinnati, OH have much lower average rates. Most service companies assume there is a negative correlation between population and average pay rate. Although this data would seem to support this assertion, it’s not always true.
Let’s look at another example. This time, the pay averages are tied to AV technician hourly rates on Field Nation from 10/26/19 through 10/26/20.
| Type of Work | Location | Average Hourly Rate | 25th percentile | 75th percentile |
| AV | Salt Lake City, UT | 55.60 | 41.00 | 65.00 |
| Philadelphia, PA | 65.00 | 50.00 | 75.00 | |
| Charlotte, NC | 50.08 | 34.25 | 60.00 | |
| New Orleans, LA | 52.43 | 40.00 | 65.00 | |
| Dallas, TX | 63.87 | 40.00 | 75.00 |
In this example, even though most metros have relatively substantial populations, hourly prices vary significantly. This showcases the value of having data on low-end, average, and high-end prices because sometimes averages are unpredictable. If you were to simply assume that more populated cities always have lower labor rates, you would not optimize your budget. That might be true for some types of work or certain locations, but how are you supposed to know when that theory is valid without access to accurate data?
This time, imagine you are trying to price networking jobs across the U.S. Here’s some data from the Field Nation network from 10/26/19 through 10/26/20.
| Type of Work | Location | Average Hourly Rate | 25th percentile | 75th percentile |
| Networking | Key West, FL | 79.46 | 55.00 | 95.00 |
| Stevens Point, WI | 57.84 | 45.00 | 60.00 | |
| Oklahoma City, OK | 49.00 | 40.00 | 60.00 | |
| Las Vegas, NV | 50.67 | 40.00 | 60.00 | |
| Las Cruces, NM | 48.91 | 40.00 | 55.00 |
In this example, you can see that in some cities, there is a significant price difference between many of the low-end vs. high-end averages. For example, a low-end price in Key West, FL is $55.00, while the high-end price is $95.00 per hour: a $40 difference. Once again, you can see that it isn’t always easy to predict the pricing differences across locations. Therefore, to accurately predict pricing, you need to rely on market-wide data instead of just your own data, or intuition.
It’s important to keep quality outcomes in mind when selecting an hourly rate for contract technicians. Paying $35 an hour for a networking technician in Key West, Florida likely won’t get you many, if any, quality candidates for a field service job.
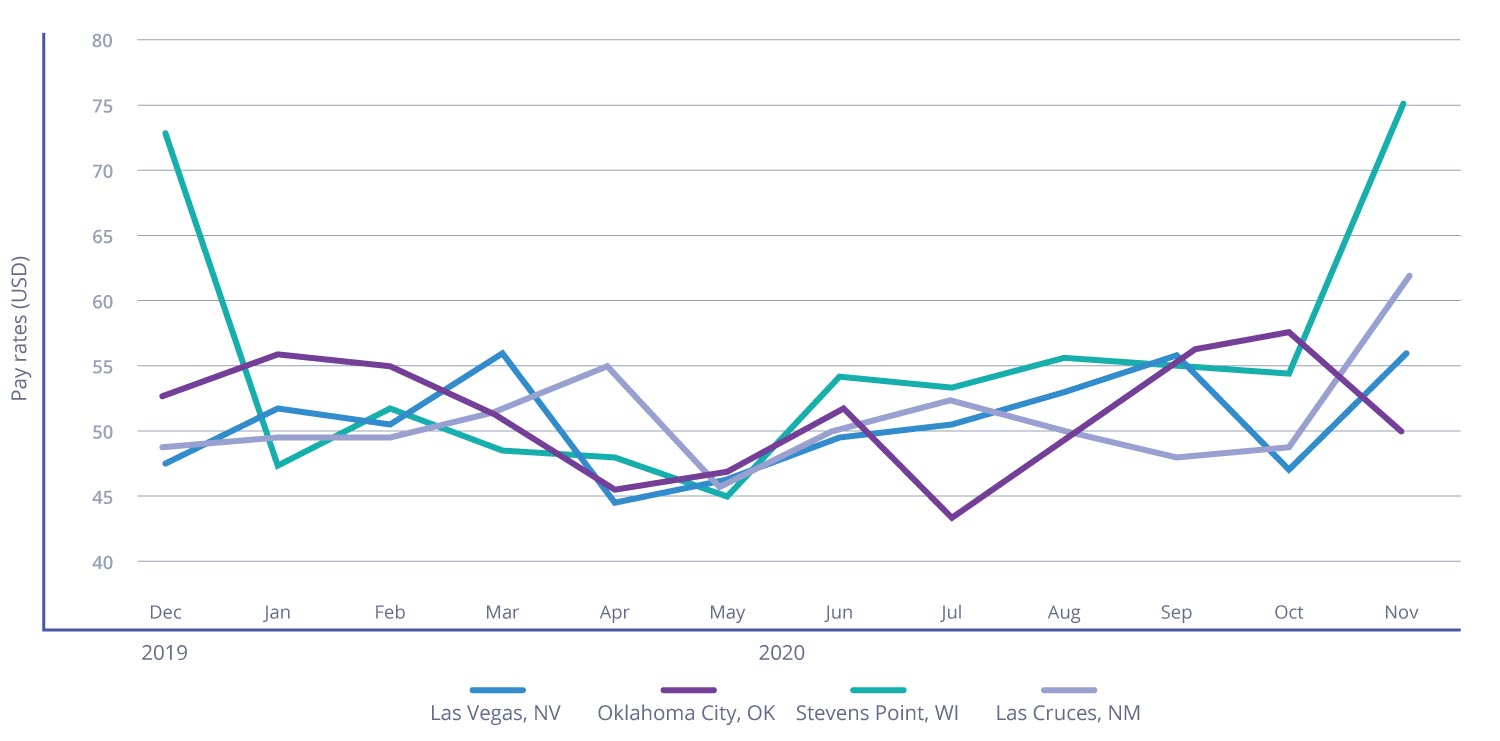
As you can see, market rates fluctuate from month to month, and April showed more variability than normal. We also see seasonal variations in Stevens Point, WI. Data can uncover these variations, and help you align rates accordingly.
As the above data shows, pricing is unpredictable. You may never know why average pay in one city is higher than another. Whether you’re pricing a project or responding to an RFP, it’s impossible to rely on intuition or only your internal data. Instead, you need real-time data from the field.
Our Field Nation Premier customers gain access to MarketSmart™ Insights, which provides real-time, on-demand, marketplace-wide coverage and pricing data, as well as historical averages. MarketSmart Insights can help you win and fulfill more work, increase margins, and monitor the effectiveness of your pricing strategies. Remember that you are always free to make your own pricing decisions, and Field Nation’s insights and suggestions are not meant to set any pay rates for you.
Prices change by area and type of work depending on the quality of technicians, willingness of buyers to pay for talent, and the number of technicians available. By automating the process of determining pay across locations and work types, dispatchers save time, money, and stress. If you’re interested in discussing on-demand, real-time pricing insights, contact our team to learn more about MarketSmart™ Insights.